
Post-Grad Guidebook
Navigating Factors to Find Your Ideal City
kate spencer, eliza tews, jessi jennings, Sarah castronovo, Zachary Slocumb
As college seniors graduate, they are met with a pressured decision:
Where to begin their next chapter?
The choice of city becomes paramount, shaping professional trajectories and quality of life. In what cities do recent graduates have the best access to employment opportunities? Where do the happiest and healthiest people live? What factors does a city need to have for it to be suitable for you?
To explore these questions, we selected 10 cities based off of Elon University's alumni chapter locations. Then, we identified key factors that make a city preferable. Using census data we were able to analyze and visualize the quality of life per city.
Our criteria encompassed a variety of factors crucial for decision making:
- Happiness Index: We incorporated the happiness index of each city, understanding that emotional well-being is integral to overall satisfaction.
- Population Data: Examining the gender demographics and the distribution of young adults aged 20-29, provided insights into the city's vibrancy and potential social opportunities.
- Employment Data: Metrics such as salary trends and employment growth shed light on career prospects and financial stability.
- Quality of Life Data: Factors like median rent, commute times, and the ratio of wages to rents contributed to our assessment of each city's livability.
- Recreational Data: Access to recreational spaces were considered essential for a well-balanced lifestyle.
Combining data from various sources, we aimed to present an overview of each city's suitability for recent graduates. This approach allowed us to offer actionable insights tailored to individual preferences and priorities, empowering college graduates to make informed decisions about their future endeavors.

Cities


Atlanta
Georgia
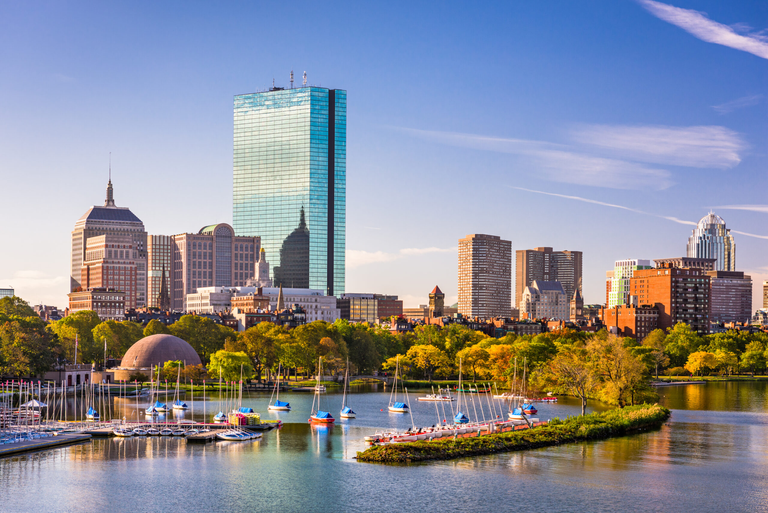
Boston
Massachusetts
Charlotte
North Carolina



Chicago
Illinois
Dallas
Texas
Los Angeles
California
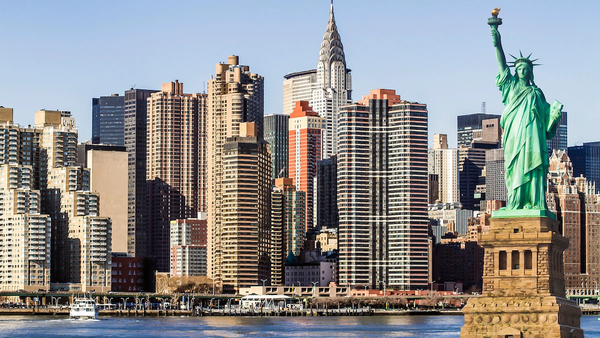


New York
New York
Philadelphia
Pennsylvania
San Francisco
California
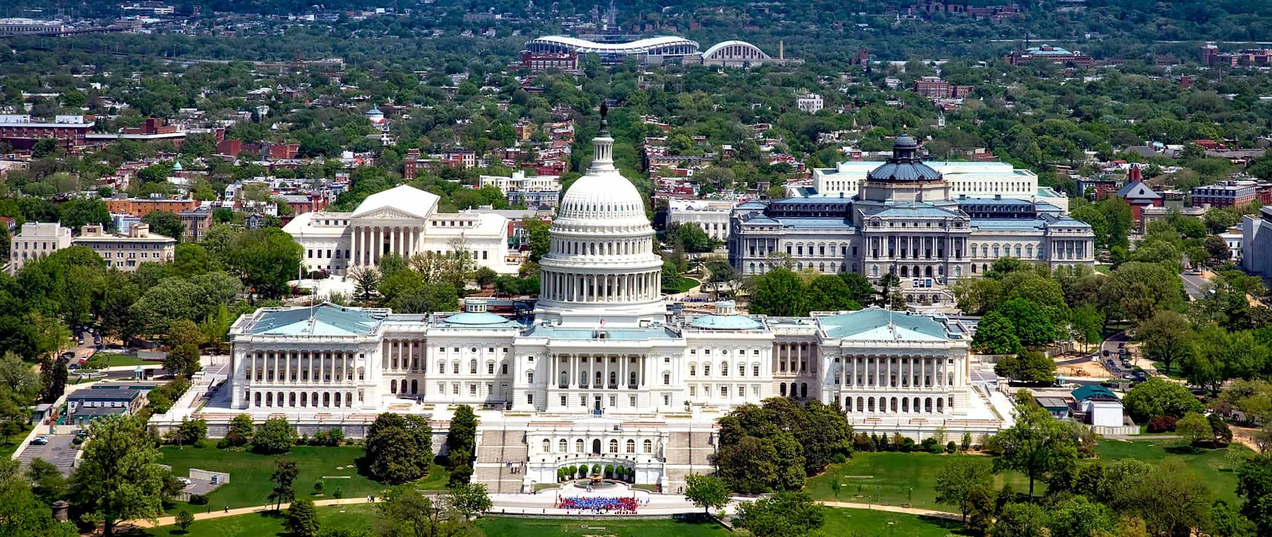
Washington
D.C.
State Happiness Scores
Data from WalletHub
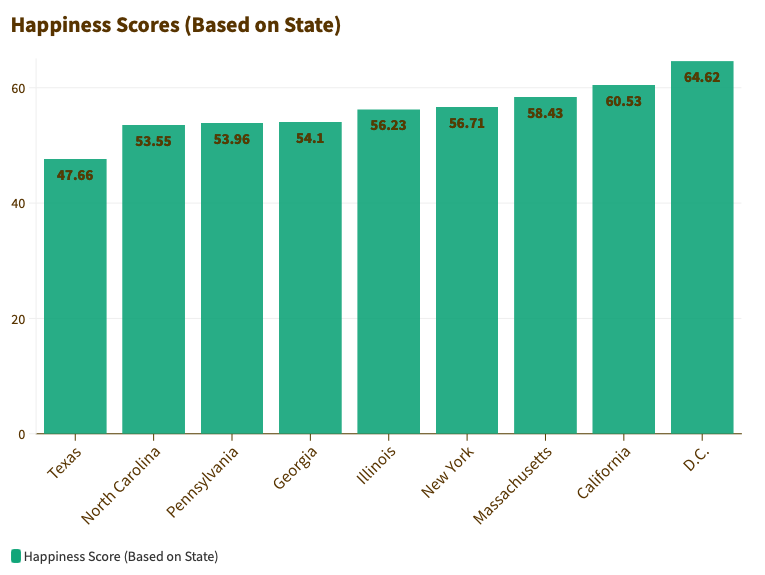
D.C. leads with the highest happiness score with 64.62
Texas has the lowest happiness score with 47.66

The choice of city is crucial, shaping professional trajectories and personal qualities that will follow young adults for the rest of their lives. Similar to picking a college, recent graduates should consider the population size of the city to ensure they enter an environment they feel comfortable in and find a sense of belonging.
Population
Younger Population

Average Salary
Money makes the world go around is what they say.
Inevitably, cities around the US come in all shapes and sizes when it comes to rent prices, and subsequently average salary.
The average yearly salary for our select US cities is $70,307.
This average puts Charlotte, Atlanta, Dallas, Philadelphia, and Chicago on the bottom half of our mean and Los Angeles, Boston, New York, DC, and San Francisco on top.
If you’re working virtually, these numbers may have significant meaning to you. If not, continue scrolling to find out what salary you can live on while affording rent and maintaining quality of life in each individual city!
*Averages calculated by payroll software professionals at Gusto
Job Growth
Job growth is also an essential statistic to pay attention to when considering professional and employment opportunities in a city.
MoneyGeek, a personal finance website, assesses the increase in employment in all of our chosen cities from December 2022 to December 2023.
The graph to the left depicts which cities had the least to most growth over that time.
San Francisco, Chicago, and Los Angeles declined in job opportunities, putting them at negative numbers.
While DC, Charlotte, and Dallas thrived over a 2.5% increase in employment for each.
MoneyGeek also assesses the increase in employment over a three year period as well.
The graph to the left depicts which cities had the least to most growth over that time.
Just like the one-year percentage growth chart, Charlotte and Dallas are jumping leaps and bounds in terms of job growth.
Boston and Atlanta had the least growth over that period of time.
Hourly Wage Growth
City | Growth in Hourly Wages over 1 year | |
1 | Washington | 0.50% |
2 | San Francisco | 0.40% |
3 | Dallas | -1.00% |
4 | Atlanta | -1.50% |
5 | Los Angeles | -1.70% |
6 | Philadelphia | -2.00% |
7 | Chicago | -3.10% |
8 | Charlotte | -3.20% |
9 | Boston | -3.40% |
10 | New York | -6.30% |
Unemployment Rate
City | Unemployment Rate | |
1 | Washington | 2.70% |
2 | Boston | 2.80% |
3 | Charlotte | 3.20% |
4 | Atlanta | 3.30% |
5 | Dallas | 3.70% |
6 | Philadelphia | 3.70% |
7 | San Francisco | 4.00% |
8 | Chicago | 4.70% |
9 | New York | 4.70% |
10 | Los Angeles | 4.90% |
Washington, D.C. takes the lead for highest growth in salary and lowest unemployment rate, showing some promising numbers for the cities job opportunities.
New York has the largest decline in hourly wages and Los Angeles has the highest unemployment rate, proving the job market to be a lesser standard than other well-performing cities.
When considering the Employment Opportunity Data presented in this section, our top picks are San Fransisco for highest average salary, Dallas for greatest increase in employment growth, and Washington, D.C. for hourly wage growth and unemployment rate.
Our Picks

Understanding the quality of life in a city hinges on key data points such as median rent, commute times, and the ratio of wages to rents. The median rent gives a good indication of the affordability of housing in a city. High median rent can indicate a city where housing costs significantly burden residents. Commute times are also important, as it can impact stress levels, productivity, and time for personal pursuits. Lastly, the ratio of wages to rents provides a snapshot of housing affordability relative to income; a higher ratio often means more disposable income for residents. Together, these factors paint a comprehensive picture of a city's livability, important for any recent grads to consider when deciding their new place of residence.
Rent per Month
Knowing the median rent for cities is vital for assessing housing affordability, which can offer insight into whether housing costs align with residents' incomes.
Comparing rental prices across different cities in March 2024, Charlotte stands out for offering the most affordable living costs with the cheapest median rent and average rent for various apartment sizes. On the other hand, cities like San Francisco and New York present contrasting rental trends. San Francisco has the most expensive studio and 1-bedroom apartments, solidifying its reputation for high living costs and a competitive housing market. New York, however, has the most expensive 2-bedroom apartments and highest median rent overall, highlighting the premium price tag that comes with living in this big city. These variations in rental prices demonstrate the diverse housing landscapes that recent graduates need to consider when choosing where to reside.
This data was sourced from Rent.com.
Salary vs. Monthly Rent
Top 3 Cities | Monthly Salary/Monthly Rent |
Washington | 40.65% |
Dallas | 41.14% |
Atlanta | 41.18% |
A common guideline from many financial studies is that one’s rent should take up no more than 30% of each paycheck. Here we see the gaps between average monthly salaries and average monthly rent.
As pictured to the right, the cities of Atlanta, Charlotte, Chicago, DC, Dallas, Philadelphia, and San Francisco all have median rent below 50% of the monthly salary. Boston, Los Angeles, and New York, have more than 50% and are not pictured in the visualization.
Washington D.C. has the lowest ratio of rent to salary at 40.65%, followed by Dallas and Atlanta. This implies that less of your salary can go to paying rent and more towards affording other costs, such as groceries, transportation, and recreational activities.
Transportation
All 10 major cities will have differences in public transit efficiency. Among the cities listed, Charlotte experiences the shortest average transportation times, while New York faces the highest. Boston and Chicago boast comprehensive public transit systems, offering efficient alternatives to driving. Atlanta and Charlotte struggle with traffic congestion on highways, impacting travel times. Washington, D.C., benefits from a well-developed public transit network, but road congestion can still occur. Dallas offers a mix of highways and public transit options, with varying commute times depending on the route. Philadelphia relies on SEPTA for public transportation, while San Francisco navigates hilly terrain and limited road infrastructure. Overall, commuters may experience different transportation times based on their chosen mode of transit and specific conditions.
This data was sourced from The US Census Bureau.
CHARLOTTE
25
minutes
NEW YORK
41
minutes
When considering Quality of Life Data presented in this section, our top picks are Charlotte and Dallas for the lowest rent and average transportation time and Washington, D.C. and Dallas for lowest percentage of monthly rent to a monthly salary.
Our Picks

Access to public parks, recreational facilities, and open spaces are essential for physical activity. It also fosters mental well-being and community engagement. In cities like San Francisco and New York, the presence of expansive public lands offers residents the opportunity to escape the urban hustle, reconnect with nature, and have spaces to release steam through exercise. These recreational amenities serve as vital components of city life, contributing to the overall desirability and livability of a community.
Before reading forward, consider how important outdoor spaces are to you? Would you like them to have parks and recreational areas close to your potential housing? How important is the quantity and quality of these green spaces?
Read below to uncover the percent of public recreational land, average transportation times, and greenery in each city.
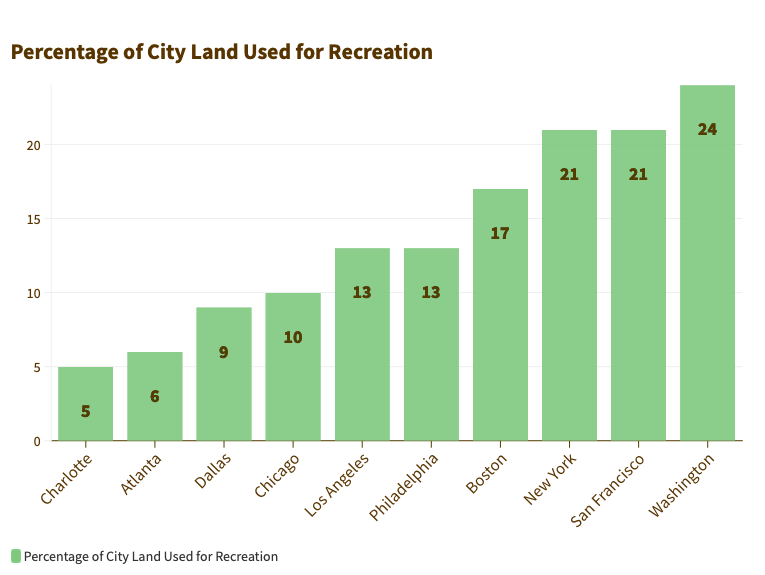
Land Used for Recreation
This chart demonstrates the percentage of city land that is used for recreation. This is significant in choosing where to live because recreational land is a great way to destress and have downtime during busy work days.
This data was sourced from “The U.S. Cities With the Most Access to Green Space.”
Washington, D.C. has the greatest percentage of land used for recreation with 24% of its land, followed by San Fransisco and New York which are tied with 21% of their land used for recreational purposes. Charlotte has the least percentage of land used for recreation with only 5%.
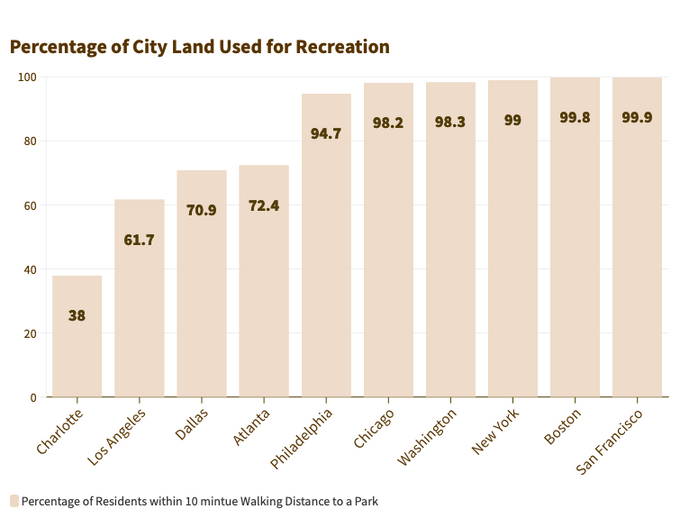
Parks + Community
If having walkable neighborhoods and public green spaces is a priority to you, it is important to know that over 95% of residents in New York, Chicago, Boston, San Fransisco, Philadelphia, and Washington live within 10 minutes to a park. Public areas shape community ties and help prevent crime because they provide environments for interaction.
The chart highlights that 38% of residents in Charlotte live within 10 minutes to a park. Atlanta, Dallas, and Los Angeles rank in the 60% to 70% range.
This data was sourced from The Census Bureau.
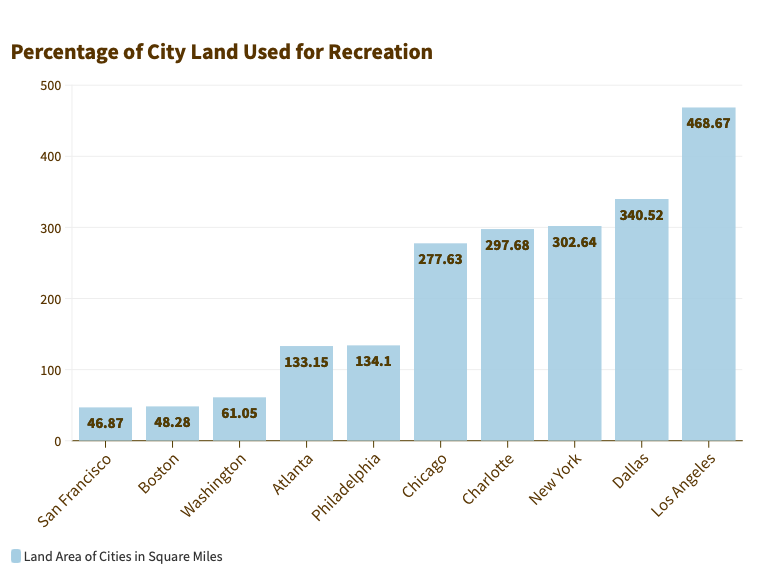
Land Area
Understanding the land area of each city in square miles is important to know to have a better understanding of the type of environment that you prefer. Bigger cities have more work opportunities, accessibility to just about everything, and better health care, entertainment, and education. Smaller cities can offer aspects such as lower living costs, a sense of community, and most likely a lower crime rate.
This data was sourced from Index Mundi.
According to the chart, Los Angeles leads with the greatest square mileage of land with 468.67 square miles, whereas San Fransisco has the lowest square mileage with 46.87 square miles, indicating that San Fransisco has about 1/10 of the square mileage of land that Los Angeles has.
When considering Recreational Data presented in this section, our top picks are Washington, D.C. for land used for recreation, and San Fransisco and Boston for percentage of residents within a 10 minute walking distance from a park.
Our Picks
Your Pick
While we can give our recommendations, we ultimately can’t make this choice for you.
As a recent or soon-to-be college graduate, the city you choose can significantly impact your professional journey and overall well-being. Through our analysis of 10 cities based on Elon University's alumni chapter locations, we've identified key factors to consider: happiness index, population demographics, employment opportunities, quality of life indicators, and recreational offerings. This comprehensive approach aims to empower you to make informed decisions that align with your preferences and priorities. We hope this has provided you with a thorough understanding of what various cities have to offer and that you are better equipped to embark on a fulfilling career path and enjoy a balanced lifestyle.
The Method
After identifying the key factors influencing the suitability of cities for recent graduates, we determined that constructing our own dataset of cities would yield the most accurate insights. First, we handpicked 10 cities by leveraging the locations of Elon University's alumni chapters. We began by collecting data from the census bureau for crucial metrics such as employment rates, population dynamics, and demographics compositions. Additionally, we tapped into various alternative sources for specifics like the happiness index, array of entertainment offerings, and rent prices. As a result, our analysis encompasses happiness scores, community guides, professional opportunities, quality of life, and recreation and land usage. Recommendations were made alongside visualizations and infographics to guide new college graduates in choosing the most suitable cities to start their careers.